Appointments Dashboard
Patient Wait Times
Snapshot
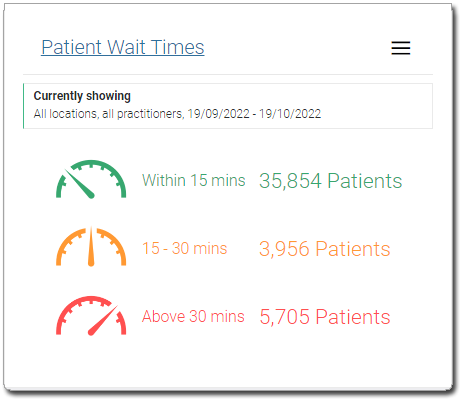
This is a retrospective tool to identify patient wait times. It is calculated using the patient’s scheduled appointment start time to the time they are marked as 'In-Consult' within Pracsoft.
This tool provides a breakdown of the number of patients who waited:
o Less than 15 minutes (green)
o 15 to 30 minutes (amber)
o More than 30 minutes (red)
Click the  button
to configure the report.
button
to configure the report.

Detail Report
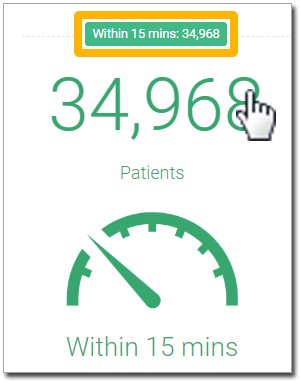
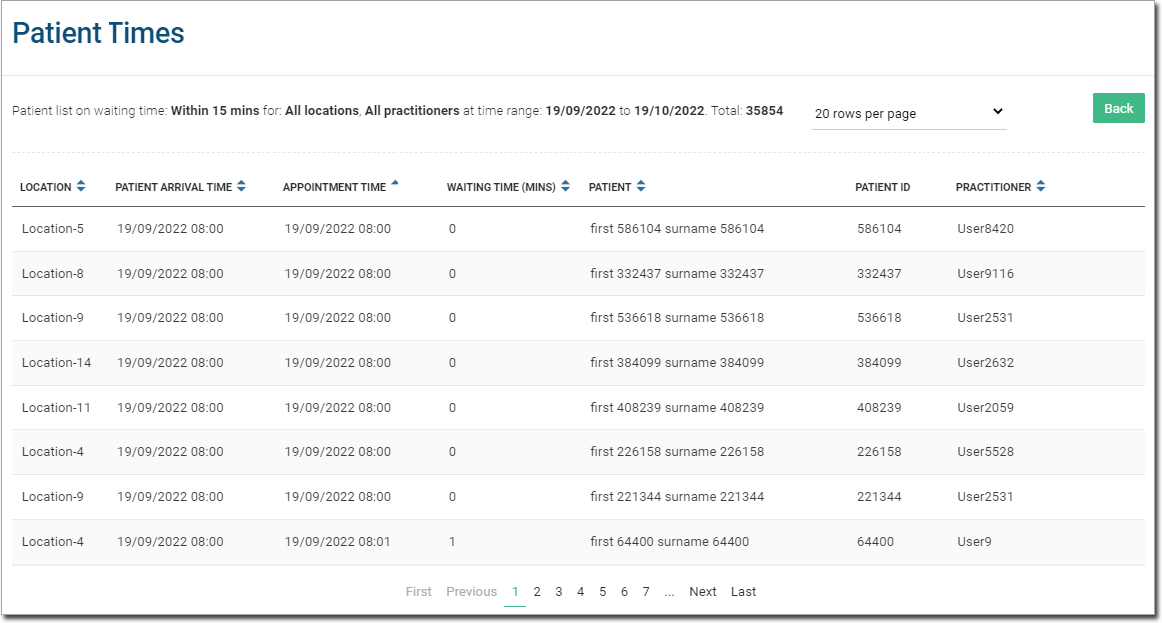
Click a data segment to drill down to the details of individual patients, and how long they waited before being seen by the practitioner.
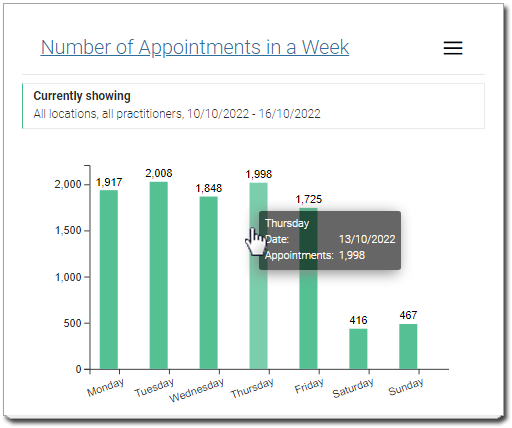
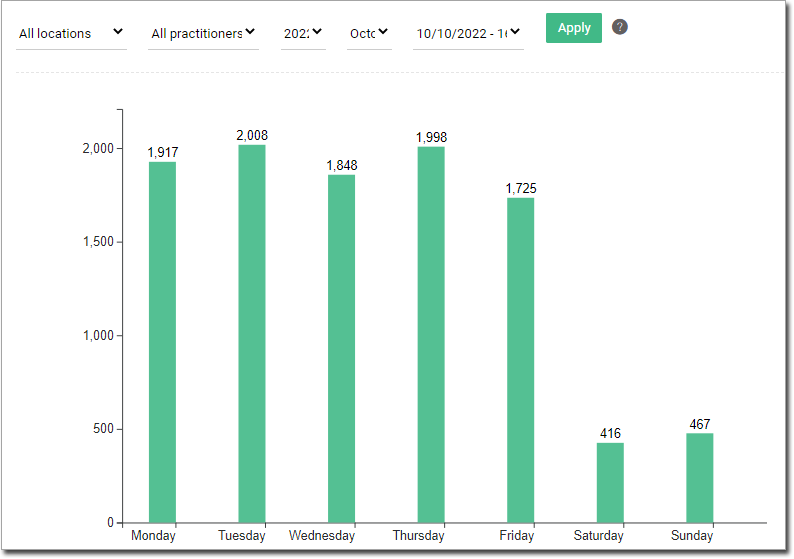
Number of Appointments in a Week
Snapshot
This is a retrospective tool to provide a snapshot of the number of appointments confirmed in any past given week (across Monday to Sunday).
Click the button
to configure the report.
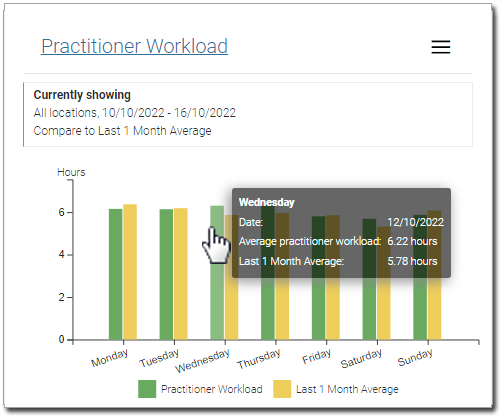
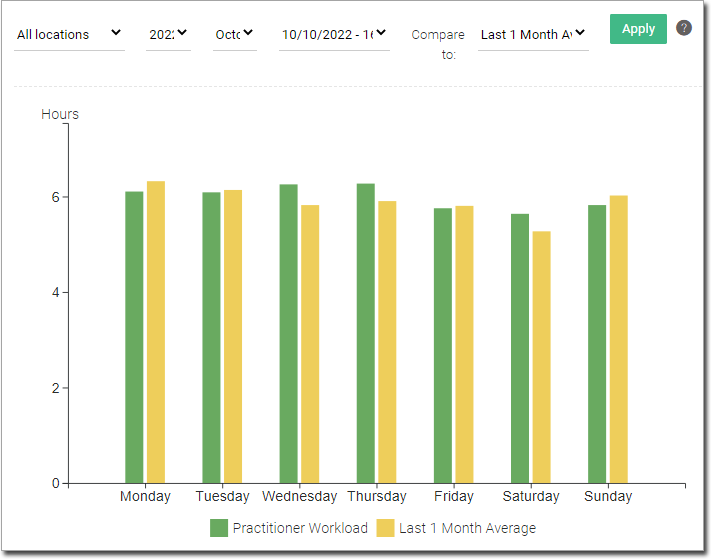
Practitioner Workload
Snapshot
This is a retrospective tool that can be used to compare practitioner workload in a selected week. Each day displayed is benchmarked against the practice's past data for that day of the week using 1, 3, 6, 12 or 24-month historic averages. Hover over a column to view data on the practitioner workload for that day (averaged across all practitioners) with the corresponding average workload for that day of the week (calculated across the time period selected).
Click the button
to configure the report.
Upcoming Appointments Eligible for an Immunisation
Snapshot
This is a forecasting tool that can be used to identify patients who have made an upcoming appointment with their practitioner and who might benefit from an immunisation based on their eligibility criteria.

Click the button
to configure the report.

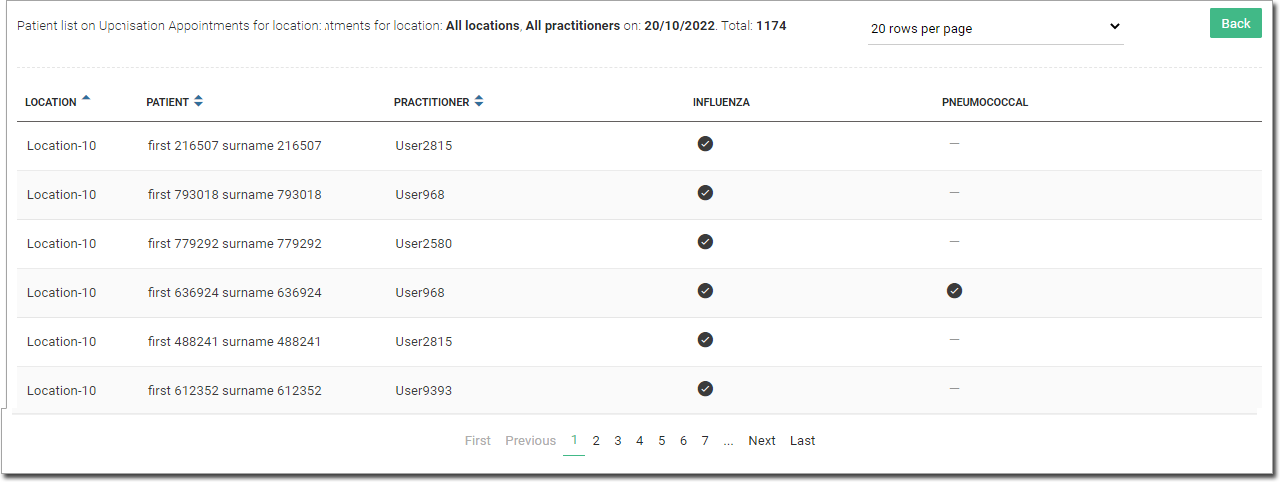
Click a day-of-the-week ‘bubble’ in the quick snapshot to view details on location, patient name, their practitioner and the vaccine type that they may be eligible for i.e. influenza and/ or pneumococcal.
Upcoming Appointments with a History of Non-Attendance
Snapshot
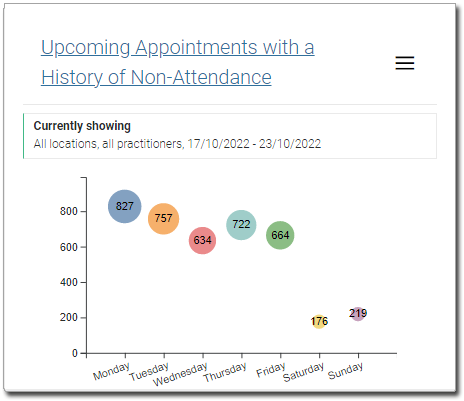
This is a forecasting tool that can be used to identify upcoming pre-booked appointments made by patients who have a repeated history of missing them. Detail is also provided on how often the patient has missed their appointments as a percentage of the total number of appointments they have made at the practice.

Click the button
to configure the report.
Snapshot with Values
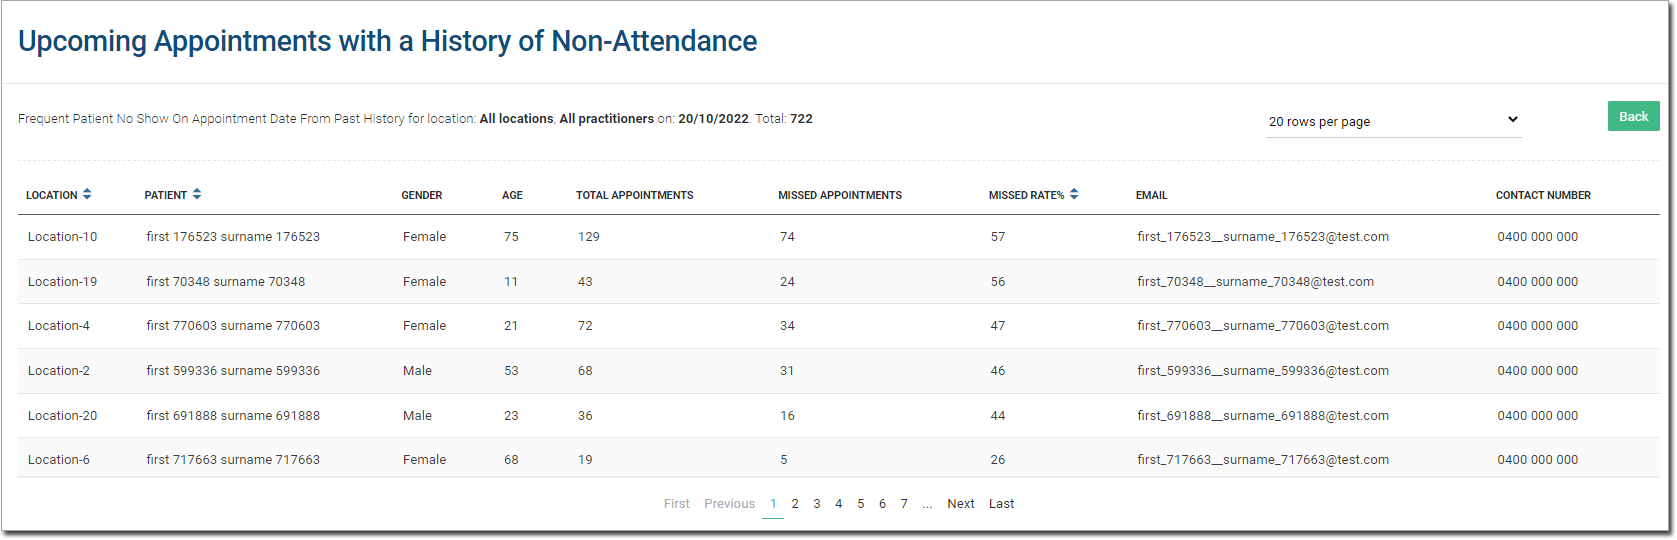
Click on a particular day of the week ‘bubble’ in the quick snapshot view and it will bring them to this drill down view (for that particular day of the week). This view provides the detail on: the location, patient, total appointments booked, total appointments missed, %missed rate, patient’s contact email and phone number.
Claims Dashboard
Frequently Claimed MBS Codes
Snapshot
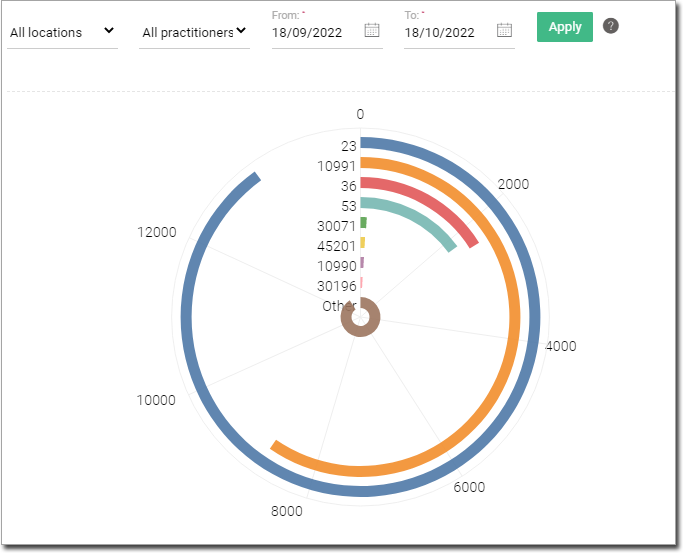
This is a retrospective tool that can be used to easily identify the most frequently claimed MBS codes and their corresponding total revenue. Hover over a coloured arc within the circle to display the MBS Item Code Number, the number of times it was billed, the revenue generated from that MBS item, the number of new patients who received that service, the number of active patients who received that service and the number of repeat but inactive patients who received that service (within the selected time frame).

Click the button
to configure the report. Hover over a coloured arc within the
circle for a drill down on that MBS item. This view provides detail
on the MBS Code, the practice location, the corresponding visit
date, the patient name (who received the service), their corresponding
ID and practitioner.
Revenue Dashboard
Eligible Private Billing Patients who were Bulk Billed
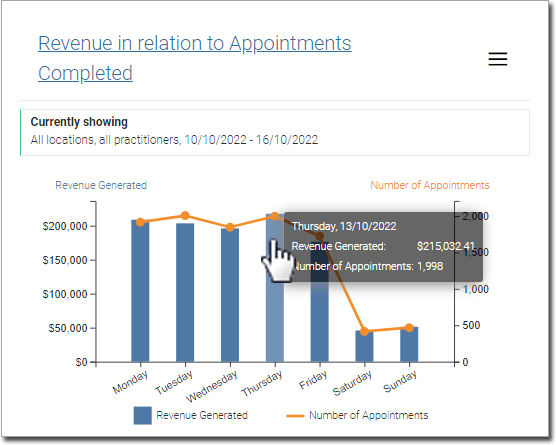
Revenue in Relation to Appointments Completed
This is a retrospective tool that provides a weekly breakdown of the revenue generated on a given day, compared to the number of patient appointments undertaken that day. Hover over a column to display values on the selected date, the revenue generated that day and the number of corresponding appointments completed.